
在机器学习中,决策树是一种预测模型,代表的是对象属性与对类别之间的一种映射关系。
一般地,一棵决策树包含一个根节点、若干个内部节点和若干个叶节点。
ID3算法是决策树的一种,它是基于奥卡姆剃刀原理的,即用尽量用较少的东西做更多的事。
ID3算法,即Iterative Dichotomiser 3,迭代二叉树3代,是Ross Quinlan发明的一种决策树算法,这个算法的基础就是上面提到的奥卡姆剃刀原理,越是小型的决策树越优于大的决策树,尽管如此,也不总是生成最小的树型结构,而是一个启发式算法。
在信息论中,期望信息越小,那么信息增益就越大,从而纯度就越高。ID3算法的核心思想就是以信息增益来度量属性的选择,选择分裂后信息增益最大的属性进行分裂。该算法采用自顶向下的贪婪搜索遍历可能的决策空间。
1976年-1986年,Ross Quinlan给出ID3算法原型并进行了总结,确定了决策树学习的理论。之后,在1993年,Quinlan将ID3算法改进成C4.5算法,称为机器学习的十大算法之一。ID3算法的另一个分支是CART(Classification and Regression Tree, 分类回归决策树),用于预测。这样,决策树理论完全覆盖了机器学习中的分类和回归两个领域。综之,ID3算法是基础和核心,深刻理解和掌握ID3算法的决策树领域的关键之所在。
决策树的算法有多种,但是核心思想都是一样的:算法通过不断的划分数据集来生成决策树,其中每一步的划分能够使当前的信息增益达到最大。
在信息增益中,重要性的衡量标准就是看特征能够为分类系统带来多少信息,带来的信息越多,该特征越重要。在认识信息增益之前,先来看看信息熵的定义
熵这个概念最早起源于物理学,在物理学中是用来度量一个热力学系统的无序程度,而在信息学里面,熵是对不确定性的度量。在1948年,香农引入了信息熵,将其定义为离散随机事件出现的概率,一个系统越是有序,信息熵就越低,反之一个系统越是混乱,它的信息熵就越高。所以信息熵可以被认为是系统有序化程度的一个度量。
假如一个随机变量$X$的取值为$X={x_1,x_2,...x_n}$,每一种取到的概率分别是${p_1,p_2,...,p_n}$,那么熵定义为
$$H(X)=-\sum\limits_{i=1}^np_ilog_2p_i$$
意思是一个变量的变化情况可能越多,那么它携带的信息量就越大。
对于分类系统来说,类别C是变量,它的取值是${C_1,C_2,...,C_n}$,而每一个类别出现的概率分别是${P(C_1),P(C_2),...,P(C_n)}$
而这里的n就是类别的总数,此时分类系统的熵就可以表示为
$$H(C)=-\sum\limits_{i=1}^np(C_i)log_2p(C_i)$$
以上就是信息熵的定义,接下来介绍信息增益。
信息增益是针对一个一个特征而言的,就是看一个特征t,系统有它和没有它时的信息量各是多少,两者的差值就是这个特征给系统带来的信息量,即信息增益。
在决策树的每一个非叶子结点划分之前,先计算每一个属性所带来的信息增益,选择最大信息增益的属性来划分,因为信息增益越大,区分样本的能力就越强,越具有代表性,很显然这是一种自顶向下的贪心策略。以上就是ID3算法的核心思想。
决策树停止的条件
如果发生以下的情况,决策树将停止分割
1、改群数据的每一笔数据已经归类到每一类数据中,即数据已经不能继续在分。
2、该群数据已经找不到新的属性进行节点分割
3、该群数据没有任何未处理的数据
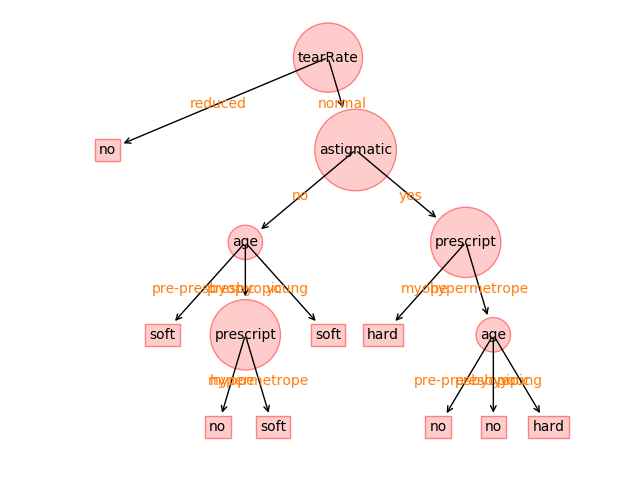
使用ID3算法来预测隐形眼镜类型,判断患者需要佩戴的镜片类型。
数据的下载地址:隐形眼镜数据
这样包括两个文件:
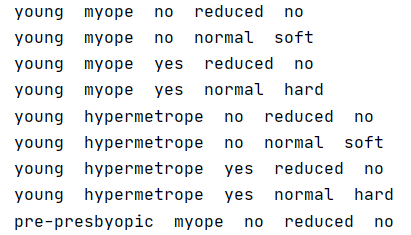
需要注意的是,lenses.data文件中的数据都是数值型,为了画出决策树,所以需要根据lenses.name文件中的内容,将lenses.data文件中的数值都转换为对应的字符串了。转换后的数据如下所示:
数据处理代码如下所示:
age = {"1": "young", "2": "pre-presbyopic", "3": "presbyopic"}
spectacle = {"1": "myope", "2": "hypermetrope"}
astigmatic = {"1": "no", "2": "yes"}
tear = {"1": "reduced", "2": "normal"}

class_ = {"1": "hard", "2": "soft", "3": "no"}

if __name__ == "__main__":
    name_file = "./lenses.data"
    all_name = []

    with open(name_file, "r", encoding="utf-8") as f:
        lines = f.readlines()
        new_lines = []
        for line in lines:
            line = line.rstrip("\n")

            line = line[3:]
            array = line.split("  ")
            new_line = "{}  {}  {}  {}  {}".format( \
                age[array[0]], spectacle[array[1]], \
                astigmatic[array[2]], tear[array[3]], \
                class_[array[4]])

            new_lines.append(new_line)

    with open("lenses.txt", "w", encoding="utf-8") as f:
        for line in new_lines:
            print(line.rstrip())
            f.write(line + "\n")
from math import log
import operator
import matplotlib.pyplot as plt

def calculate_shannon_entropy(dataSet):
    data_num = len(dataSet)
    class_count = {}
    for data in dataSet:
        class_ = data[-1]
        if class_ not in class_count.keys():
            class_count[class_] = 0
        class_count[class_] += 1
    shannon_entropy = 0.0
    for class_ in class_count.keys():
        prob = float(class_count[class_]) / data_num
        shannon_entropy -= prob * log(prob, 2)
    return shannon_entropy


def split_dataset(dataSet, featureIndex, featureValue):
    new_dataset = []
    for data in dataSet:
        if data[featureIndex] == featureValue:
            new_data = data[:featureIndex]
            new_data.extend(data[featureIndex + 1:])
            new_dataset.append(new_data)
    return new_dataset


def choose_best_feature(dataSet):
    feature_num = len(dataSet[0]) - 1
    base_entropy = calculate_shannon_entropy(dataSet)
    best_info_gain = 0.0
    best_feature_index = -1
    for i in range(feature_num):
        feature_list = [data[i] for data in dataSet]
        unique_feature_value_set = set(feature_list)
        new_entropy = 0.0
        for value in unique_feature_value_set:
            subDataSet = split_dataset(dataSet, i, value)
            prob = len(subDataSet) / float(len(dataSet))
            new_entropy += prob * calculate_shannon_entropy(subDataSet)
        info_gain = base_entropy - new_entropy
        if info_gain > best_info_gain:
            best_info_gain = info_gain
            best_feature_index = i
    return best_feature_index


def get_majority_class_count(class_list):
    class_count = {}
    for class_ in class_list:
        if class_ not in class_count.keys():
            class_count[class_] = 0
        class_count[class_] += 1
    sorted_class_count = sorted(class_count.items(), key=operator.itemgetter(1), reverse=True)
    return sorted_class_count[0][0]


def create_tree(dataSet, featureLabel):
    class_list = [data[-1] for data in dataSet]
    if class_list.count(class_list[0]) == len(class_list):
        return class_list[0]
    if len(dataSet[0]) == 1:
        return get_majority_class_count(class_list)
    best_feature_index = choose_best_feature(dataSet)
    best_feature_label = featureLabel[best_feature_index]
    myTree = {best_feature_label: {}}
    del featureLabel[best_feature_index]
    feature_values = [data[best_feature_index] for data in dataSet]
    unique_feature_values = set(feature_values)
    for feature_value in unique_feature_values:
        new_feature_label = featureLabel[:]
        myTree[best_feature_label][feature_value] = create_tree(
            split_dataset(dataSet, best_feature_index, feature_value), new_feature_label)
    return myTree

def plot_node(text, xytext, xy, nodeType):
    global ax1
    ax1.annotate(text, xy=xy, xycoords="axes fraction", xytext=xytext, textcoords="axes fraction",
                 va="center", ha="center", bbox=nodeType, arrowprops=arrow_args)


def get_leaf_num(myTree):
    leaf_num = 0
    parent_node = list(myTree.keys())[0]
    child_node = myTree[parent_node]
    for node in child_node.keys():
        if type(child_node[node]).__name__ == "dict":
            leaf_num += get_leaf_num(child_node[node])
        else:
            leaf_num += 1
    return leaf_num


def get_tree_depth(myTree):
    max_depth = 0
    parent_node = list(myTree.keys())[0]
    child_node = myTree[parent_node]
    for node in child_node.keys():
        if type(child_node[node]).__name__ == "dict":
            this_depth = 1 + get_tree_depth(child_node[node])
        else:
            this_depth = 1
        if this_depth > max_depth:
            max_depth = this_depth
    return max_depth


def plot_mid_text(currentPositon, parentPosition, nodeTxt):
    x = (parentPosition[0] - currentPositon[0]) / 2 + currentPositon[0]
    y = (parentPosition[1] - currentPositon[1]) / 2 + currentPositon[1]
    global ax1
    text_kwargs = dict(ha="center", va="center", fontsize=10, color="C1")
    ax1.text(x, y, nodeTxt, **text_kwargs)


def plot_tree(myTree, parentPosition, node):
    leaf_num = get_leaf_num(myTree)
    parent_node = list(myTree.keys())[0]
    global x_offset, y_offset, total_width, total_depth
    currentPositon = (x_offset + (1 + float(leaf_num)) / 2 / total_width, y_offset)
    plot_node(parent_node, currentPositon, parentPosition, decision_node)
    plot_mid_text(currentPositon, parentPosition, node)
    child_node = myTree[parent_node]
    y_offset = y_offset - 1 / total_depth

    for node in child_node.keys():
        if type(child_node[node]).__name__ == "dict":
            plot_tree(child_node[node], currentPositon, str(node))
        else:
            x_offset = x_offset + 1 / total_width
            plot_node(child_node[node], (x_offset, y_offset), currentPositon, leaf_node)
            plot_mid_text((x_offset, y_offset), currentPositon, str(node))

    y_offset = y_offset + 1 / total_depth


def create_plot(inTree):
    fig = plt.figure(1, facecolor="antiquewhite")
    fig.clf()
    axprops = dict(xticks=[], yticks=[])
    global ax1
    ax1 = plt.subplot(111, frameon=False, **axprops)
    global x_offset, y_offset, total_depth, total_width
    total_width = float(get_leaf_num(inTree))
    total_depth = float(get_tree_depth(inTree))
    x_offset = -0.5 / total_width
    y_offset = 1.0
    plot_tree(inTree, (0.5, 1.0), "")
    plt.show()


def predict_lenses():
    file = open("lenses.txt")
    dataSet = [line.strip().split("  ") for line in file.readlines()]
    featureLabel = ["age", "prescript", "astigmatic", "tearRate"]
    lensesTree = create_tree(dataSet, featureLabel)
    create_plot(lensesTree)


if __name__ == "__main__":
    total_width = None
    total_depth = None
    x_offset = None
    y_offset = None
    ax1 = None
    decision_node = dict(boxstyle="circle", ec=(1., 0.5, 0.5), fc=(1., 0.8, 0.8))
    leaf_node = dict(boxstyle="square", ec=(1., 0.5, 0.5), fc=(1., 0.8, 0.8))
    arrow_args = dict(arrowstyle="<-")
    predict_lenses()
评论专区
评论加载中...登录后即可发表评论